Monday, September 12, 2011

Page Views - there are better metrics out there

So many metrics
There is certainly no shortage of metrics or reports to choose from in the web analytics world. Which one is the best? Which is the most important? Page views, visits, visitors, and bounce rate seem to be some of the most popular and foundational metrics, and there are so many others!

Around here, page views seem to be the staple metric that people use most or fall back to, almost by default. It is a metric that you gives you an idea of total pages consumed by your web site users. Most analytic platforms will count pages as they after they are fully loaded, count page reloads, and give the number as a cold, hard, quantity. And as with any metric, a single number is much less meaningful without context and is better viewed as a trended report over some meaningful amount of time.

Story
There is a legendary story in my family that reminds of the page view metric.

Years ago, before I was born, my parents and all my mother's siblings visited several of the art and field museums in the city of Chicago. My father and one of my aunts were not particularly big fans of strolling leisurely through museum exhibits. So, while the rest of the group took their time to really experience each exhibit and internalize the inspiration of the arts, my father and aunt briskly made their way up and down each aisle and hastily breezed through each museum almost racing to get to the end.

At the end of the day someone in the group asked this aunt and my dad if they had seen this beautiful exhibit with the incredible display of something or other, to which these two responded, "If it was in there, we saw it."

Their visit through the museums, like the page view metric, measured quantity without any indicator to the quality experienced along with it. My father and my aunt had the largest "page view" count on that day, but their experience was not an engaged one, nor did it likely meet the goals of the museum staff. My father and aunt will probably not return to see the museums nor will they remember much of what they "saw." The page view report is very similar to the legendary response, "if it was in there, we saw it."

Other Metrics
With the page view report, you could be looking at a thousand people each viewing one single page, or perhaps less likely, a single person viewing a thousand pages. It could represent dozens of people enjoying their time on your site, consuming multiple pages, internalizing each one. Or, it could reflect a few people clicking around aimlessly looking for something and having a frustrating time doing it.

There are better metrics out there. Many of these other metrics make great companions to enhance the page view report, helping to tell the whole story; they provide insight to the quality, not just the quantity of the experience.

Consider coupling your page view report with one or more of the following reports to get a better idea about the quality of those views:

  • percentage of page viewed
  • number of social shares for the page
  • time spent on page
  • bounce rate for those coming in to, or exit rate of those leaving from a particular page
  • amount of video consumed on the page
  • downloads from each page
  • return frequency of those that viewed the page
  • unique success events for your business, for your page
  • other windfall, down stream activity that could be attributed to the page

Saturday, September 10, 2011

Omniture Debugger revisited - helping to close the gap

The Problem
There is a gap that exists between the implementation and the reporting for any web analytics solution. That gap is even wider, separating those writing the code and those looking at the reports. Omniture is not only not an exception, but might be the poster child to this statement. Ultimately, a fundamental understanding of the implementation leads to better use of the reports, more accurate interpretation of the data, and more thorough analysis.

Frankly, the gap exists because many developers do not regularly look at or use the reports from the data they are collecting with their analytics code. They make their best guesses when it comes to page and site section names, custom link tracking names, and other subjectively named variables. But unless those same developers have a clear understanding of the business goals and regularly assist in the analysis and interpretation of the data, it becomes a bit too much like a black box.

Similarly, for the non-technical business user who may browse through Omniture SiteCatalyst reports, looking at custom traffic charts and custom conversion graphs, a lack of understanding about the implementation will lead to a diminished understanding and less than optimal use of the data.

The savvy web developer may have no problem looking through the source html and accompanying javascript to find what he needs. But for the non-technical crowd this presents a very daunting, even discouraging, hurdle.

The Solution
Luckily for all, there are a myriad tools available that can help to narrow that gap: the Omniture debugger, HTTP Fox, FireBug, IE Web Developer tools, Chrome developer tools, Charles, and the list of other http debugger/sniffer tools goes on and on.

I will focus on the Omniture debugger and look briefly at a few of the other options.

The Omniture debugger is a very simple option for viewing the variables and their values for a given page. While not technically a true plugin, it is a helpful utility and provides immense value toward closing the aforementioned gap.

Steps to install:
  1. Create a place holder bookmark (could be any page, even this one).
    • Drag URL bar icon to your favorites menu or hit ctrl-d in most browsers

  2. Edit the properties of the bookmark to include this debugger code snippet.
    • Right click and select edit (Chrome) or properties (FireFox or IE).
    • Rename the bookmark to something more meaningful like Omniture Debugger or Omniture Info.
    • Paste in the following javascript over the bookmarked URL (I told you you could use any page)

      javascript:void(window.open("","dp_debugger","width=600,height=850,location=0,menubar=0,status=1,toolbar=0,resizable=1,scrollbars=1").document.write("<script language=\"JavaScript\" id=dbg src=\"http://www.digitalpulse.omniture.com/dp/debugger.js\"></"+"script>"));

  3. On any page with Omniture code, click the newly created bookmark to bring up the debugger window. 
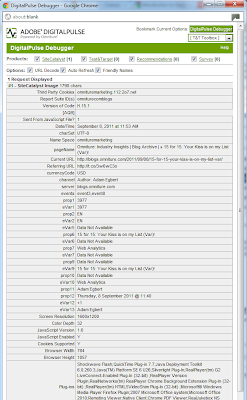
    • If there is working code on the page, you'll see something like this, with variables and their values.
    • If there is not working code on the page, you'll see something like this, without any information.


Conclusion
There are a few things to be aware of:

  • The debugger will update as you navigate from page to page (most of the time)
  • It seems to have trouble updating when you browse across multiple report suites
  • It displays values of variables that are set and sent with the s.t() function call
  • Custom link tracking will also show up when the s.tl() function is called

Thursday, September 1, 2011

Quick Look: Bounce Rate

Bounce rate has become a popular metric lately. SiteCatalyst 15 includes it as one of the default reports in the Site Overview dashboard, it's a hit with anyone working on SEO/SEM strategies, and Avinash himself called it the "sexiest web metric ever" (see links below).

I find myself explaining the finer details of the bounce rate metric quite often and would like to compile a concise post that helps people understand how to interpret the numbers a little better.

Bounce rate is the percentage of single-page visits or visits in which the person left your site from the entrance (landing) page. Put another way, it represents the ratio of visits that ended on the same page that they started, without clicking or viewing anything else, divided by total visits.

For me, and for the type of traffic we see at our organization, bounce rate is much more meaningful when we look at traffic coming from a search engine or social site. This is traffic that has some level of curiosity and has come to your site, maybe for the first time ever, looking for something, expecting to find what they are in search of, or anticipating a certain level of goodness (maybe trusting the source that shared the link via social media, for example). Yet, once they have clicked the search result or socially shared link, they quickly realize that the page is not what they were looking for, did not meet their expectation, and did not  fulfill their anticipation for goodness, and they hastily leave your site.

We see a certain level of bounce from direct traffic (bookmarked, URLs typed in by hand, etc.), particularly on our homepage, and I am prone to shrug it off. Why? Analysis has shown that much of this bouncy traffic may have our homepage as the default homepage for their browser. Traffic coming direct to your site is more likely familiar with what they will find and represent a different portion of the audience that is less significant in my opinion, when it comes to bounce rate at least.  Not worthless traffic, and by no means should it be ignored. But it is less meaningful and actionable to chase the bounce rate associated to direct traffic.

The metric feels especially confusing at our organization where we have dozens of report suites, many of which are for subsections of the large corporate website. So it will appear that you have a bounce on your page when you are looking at your specific report suite, when really the visit crossed through multiple pages within the organization. This is ultimately a fragmentation problem that we have to deal with, and will be able to address with the ability to segment in SiteCatalyst 15. It can also be viewed using a global report suite to get a broader context of the visit.

When it comes down to it, bounce rate is a confusing but very actionable metric. Changes can and should be made on key landing pages to decrease the number. Landing page may be ranking for keywords that are misleading to the visitor. Social network campaigns might not be targeting the correct audience or are giving the audience misconceptions of what they will find. The page might not have any other calls to action, useful navigation, or overall relevance, and most of those things can be fixed.

In a data filled world with no shortage of numbers, metrics, charts, and reports, it's nice to have one that you can do something about, once you understand it.

Other helpful blogs on the subject of bounce rate:

Wednesday, August 31, 2011

A SiteCatalyst 15 side affect - RIP s.prop

With the recent release of SiteCatalyst 15, life as a web analyst has suddenly become much more fun.

The new features have opened up a whole new world of possibilities. Specifically, the incredible insights that can be gleaned from segmentation have me creating segments in my dreams at night. Dashboards have become much more useful with the ability to get big picture overviews and then compare the differences between individual segments and the overall average traffic. Other features are incredibly helpful too, and the enjoyment of the day-to-day activities of analysis and reporting has only increased.  Food even tastes better as a result, though I have no quantifiable way to attribute that back to our organization's upgrade to SiteCatalyst 15.

But in my mind, there is at least one casualty of SiteCatalyst 15: the s.prop. I'm not entirely saying that the s.prop is dead (well, I guess I did say that with the term RIP) nor has it completely lost its value. But I do believe it has significantly diminished in its effectiveness compared to the more powerful eVar.

Quickly reviewing the Omniture SiteCatalyst Implementation Manual reminds us that Custom Insight Variable (s.props) can provide us the following types of reports:


  • Understanding user navigation through the web site
  • Understanding internal user search behavior
  • Segmenting traffic by navigation or category
  • Segmenting visitor behavior by demographics
There's no denying the insight provided by a pathing report that you get with s.props that you can't get with the good ol' eVar. And having the ability to set up correlations is pretty helpful. But I have to set those up manually. And I only have twelve per report suite.

But with SiteCatalyst 15, I get full subrelations for all my conversion reports. For free. By default. No manual configuration. No limit per report suite. Just plain and sweet, for all my eVar reports.

And ultimately, I care more about conversion data than I do about traffic numbers. While it's nice to know how many times a value was populated into a s.prop, I can get a similar count using an eVar, and then I can break that down by my other reports.

So, agree or disagree? Has the s.prop lost some of it's value when compared to the eVar, with its wonderful full subrelations available in SiteCatalyst 15? What am I missing?

Thursday, August 18, 2011

Quick Look: Comparing GA and Omniture numbers

There is a constant battle in the web analytics world about tools. Some are free, others are expensive. Some will argue that one particular product is very simple while alternatives are too complicated. Another point of debate is the accuracy of one tool vs. another, and understanding why the discrepancy exists. It's really no different than any other industry. I remember the exact same debate as a developer arguing over which IDE was the best for writing code.

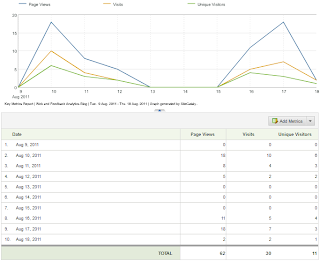
So I thought I'd take a quick look at the meager metrics that this blog has pulled in thus far and report back.

Surprisingly, the numbers are almost identical. This might be a side effect of such a small sample size (I'm not delusional about the popularity of my little blog). When we run this test again in 6 months, would we expect a bigger difference? Are there other metrics that would be worth comparing?

Analytics Tool Page Views Visits Unique Visitors Bounce Rate
Omniture SiteCatalyst 62 30 1150%
Google Analytics 61 30 1053%

A few other thoughts:

  • Geo Segmentation showed the exact same countries represented.
  • Average Time Spent on Site was much higher in SiteCatalyst
  • Both show one visit from an iPhone
  • The Visitor Loyalty/Visit Number Report was pretty similar in both


So, let's try this again in a few months and see what differences start to emerge.

Tuesday, August 16, 2011

Web Analytics Discussion Panel - Questions Wanted

Today I fired off a few presentation proposals for an internal tech conference coming up later this fall. I thought of several areas of deficiency at our organization that I thought would make for good presentations: Web Analytics for Developers and Quality Assurance Engineers, A/B Testing Strategies and Real World Examples, and Web Analytics - the What, Why, and How.

I also had the idea that a semi-formal panel discussion including a few key, experienced analytics individuals at our company would be fun and informative. I would moderate the panel and facilitate some open Q&A. I would also personally invite the panel members that I feel would bring personality, experience, and meaningful insight to the discussion. I would like to focus on questions relating to best practices, real world examples of application, and how analytics and feedback data have benefited the team and projects.

So, my question to you, the savvy analytics audience, what are some questions that would be a good fit to use in a web analytics panel discussion?

Wednesday, August 10, 2011

Web and Feedback Analytics Intro

I spend a lot of time lately meeting with project teams, administrative staff, product managers, project managers and everyone in between. We talk about the whole gamut of web and feedback analytics, the data, the reports, interpreting the data and reports, the implementation in code, configuration of our tools, and on and on. So, the natural next step was to start a blog to capture many of those great conversations and provide a repository of resources about the subject.

I'm hoping to include a variety of things in this blog:

  • code snippets
  • implementation best practices
  • analytics theory
  • using customer feedback
  • actionable insights
  • use cases
  • links to other helpful blogs and articles
  • real world stories
  • statistics talk
  • and who knows what else
I will focus most of my attention on Omniture with some Google Analytics. I will need to be discreet about specific websites in many cases but hope to share plenty of helpful tidbits and insights that were a benefit to me.