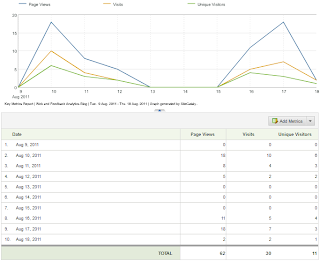
So many metrics
There is certainly no shortage of metrics or reports to choose from in the web analytics world. Which one is the best? Which is the most important? Page views, visits, visitors, and
bounce rate seem to be some of the most popular and foundational metrics, and there are so many others!
Around here, page views seem to be the staple metric that people use most or fall back to, almost by default. It is a metric that you gives you an idea of total pages consumed by your web site users. Most analytic platforms will count pages as they after they are fully loaded, count page reloads, and give the number as a cold, hard, quantity. And as with any metric, a single number is much less meaningful without context and is better viewed as a trended report over some meaningful amount of time.
Story
There is a legendary story in my family that reminds of the page view metric.
Years ago, before I was born, my parents and all my mother's siblings visited several of the art and field museums in the city of Chicago. My father and one of my aunts were not particularly big fans of strolling leisurely through museum exhibits. So, while the rest of the group took their time to really experience each exhibit and internalize the inspiration of the arts, my father and aunt briskly made their way up and down each aisle and hastily breezed through each museum almost racing to get to the end.
At the end of the day someone in the group asked this aunt and my dad if they had seen this beautiful exhibit with the incredible display of something or other, to which these two responded, "
If it was in there, we saw it."
Their visit through the museums, like the page view metric, measured quantity without any indicator to the quality experienced along with it. My father and my aunt had the largest "page view" count on that day, but their experience was not an engaged one, nor did it likely meet the goals of the museum staff. My father and aunt will probably not return to see the museums nor will they remember much of what they "saw." The page view report is very similar to the legendary response, "if it was in there, we saw it."
Other Metrics
With the page view report, you could be looking at a thousand people each viewing one single page, or perhaps less likely, a single person viewing a thousand pages. It could represent dozens of people enjoying their time on your site, consuming multiple pages, internalizing each one. Or, it could reflect a few people clicking around aimlessly looking for something and having a frustrating time doing it.
There are better metrics out there. Many of these other metrics make great companions to enhance the page view report, helping to tell the whole story; they provide insight to the quality, not just the quantity of the experience.
Consider coupling your page view report with one or more of the following reports to get a better idea about the quality of those views:
- percentage of page viewed
- number of social shares for the page
- time spent on page
- bounce rate for those coming in to, or exit rate of those leaving from a particular page
- amount of video consumed on the page
- downloads from each page
- return frequency of those that viewed the page
- unique success events for your business, for your page
- other windfall, down stream activity that could be attributed to the page

